Left-side panel and Dashboard
Paybis Partner Portal provides Partner with a full overview of financial performance. This guide focuses on the Dashboard section where earnings and transaction volume could be tracked.
Financial Summary
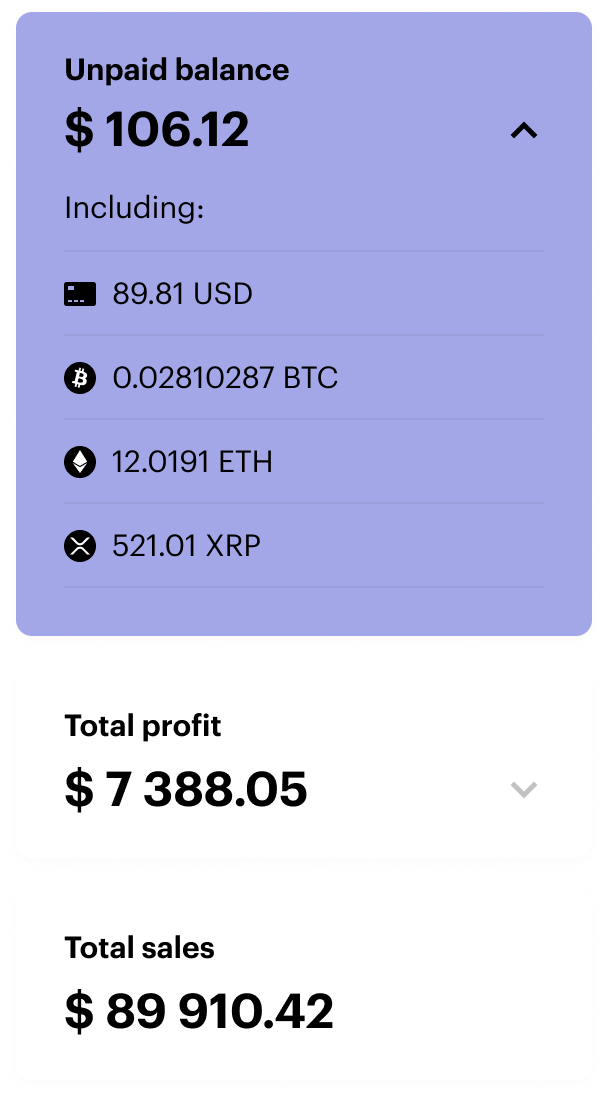
Key Metrics:
Unpaid Balance: This is the total amount you've earned through the Paybis integration that has not yet been paid out to you. It represents the Partner's pending earnings, including a breakdown of the Partner's unpaid balance in different currencies, such as USD, BTC, ETH, and others. It allows Partner to see how Partner's earnings are distributed across various cryptocurrencies and fiat currencies.
Total Profit: This is the cumulative profit you've made through Partner's Paybis integration since Partner started using it. It provides a snapshot of Partner's overall earnings over time.
Total Sales: This represents the total value of all transactions processed through Partner's integration with Paybis. It's a key indicator of the overall volume of business you're generating through the platform.
Profit and Turnover
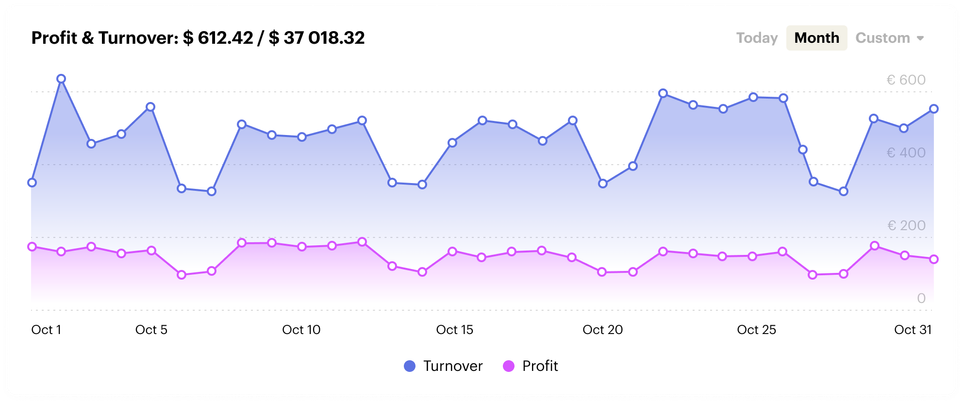
Key Elements
Profit & Turnover: This section displays the Partner's total profit (what you've earned after fees) and turnover (total transaction value) for the selected time period.
Time Filters: Choose between the "Today," "Month," and "Custom" filters to analyze Partner's performance over different timeframes.
How to Use the Profit and Turnover Graph:
- Select Timeframe: Choose the desired time filter to view the Partner's performance for a specific period.
- Analyze Trends: Observe the graph to identify any patterns or fluctuations in Partner's profit and turnover.
- Identify Peak Periods: Note the days or weeks where Partner's earnings were highest, and investigate any factors that may have contributed to this success.
- Identify Low Periods: Similarly, take note of any periods where Partner's earnings were lower, and analyze potential causes or areas for improvement.
- Compare Profit and Turnover: Compare the two lines to see how Partner's profit margins are changing over time.
By regularly analyzing Partner's profit and turnover graph, Partner can gain valuable insights into Partner's business performance and make data-driven decisions to optimize Partner's strategies and maximize Partner's earnings.
Transactions
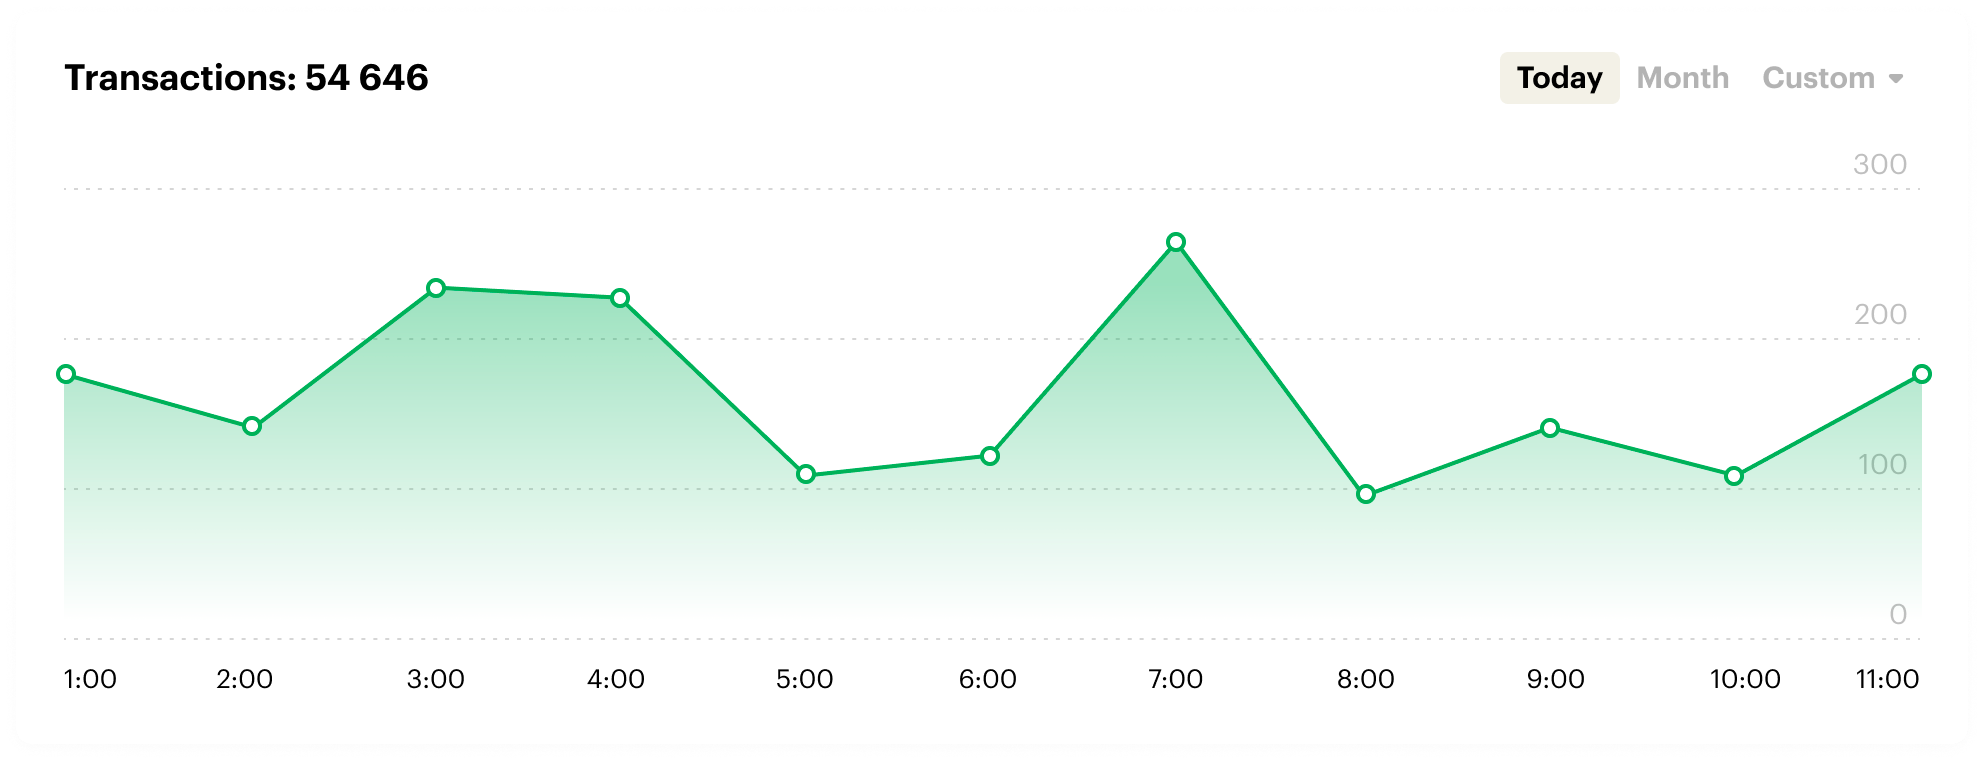
Key Elements
Transactions: This number at the top left displays the total transactions completed during the selected time period. It's a good indicator of overall activity on Partner's platform.
Time Filters: Choose between the "Today," "Month," and "Custom" filters to analyze Partner's performance over different timeframes.
How to Use the Transactions Graph
- Choose a Timeframe: Select the appropriate time filter based on the Partner's analysis needs.
- Analyze Trends: Look for patterns in the graph. Are there peak times when transactions are more frequent? Are there any significant dips?
- Identify Opportunities: Use this data to understand Partner's customers' behavior and identify potential areas for improvement or promotion.
By regularly checking the Transactions graph, the Partner can gain valuable insights into how the Partner's integration with Paybis is performing and make informed decisions to optimize the Partner's business strategies.
Success rate
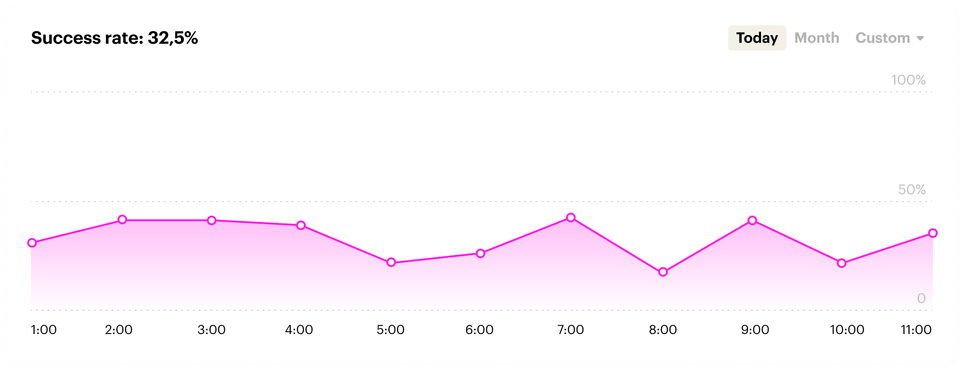
Key Elements
Success Rate: The percentage displayed shows the overall rate of successful transactions within the chosen timeframe. A higher success rate indicates a smoother user experience and fewer issues during the transaction process.
Time Filters: Choose between the "Today," "Month," and "Custom" filters to analyze Partner's performance over different timeframes.
How to Use the Success Rate Graph
- Choose a time frame: Select the time filter that best aligns with Partner's analysis goals.
- Analyze Trends: Observe the graph to identify patterns in Partner's success rate. Are there specific times or days when it's higher or lower?
- Identify Issues: A declining success rate may indicate technical problems or points of friction in the user journey. Investigate any drops and take action to address them.
- Track Improvements: After making changes, monitor the graph to see if Partner's success rate improves.
By regularly reviewing the Success Rate graph, Partner can gain valuable insights into the effectiveness of Partner's Paybis integration and make data-driven decisions to optimize the user experience and boost Partner's overall transaction success.
Top Countries and Cryptocurrencies
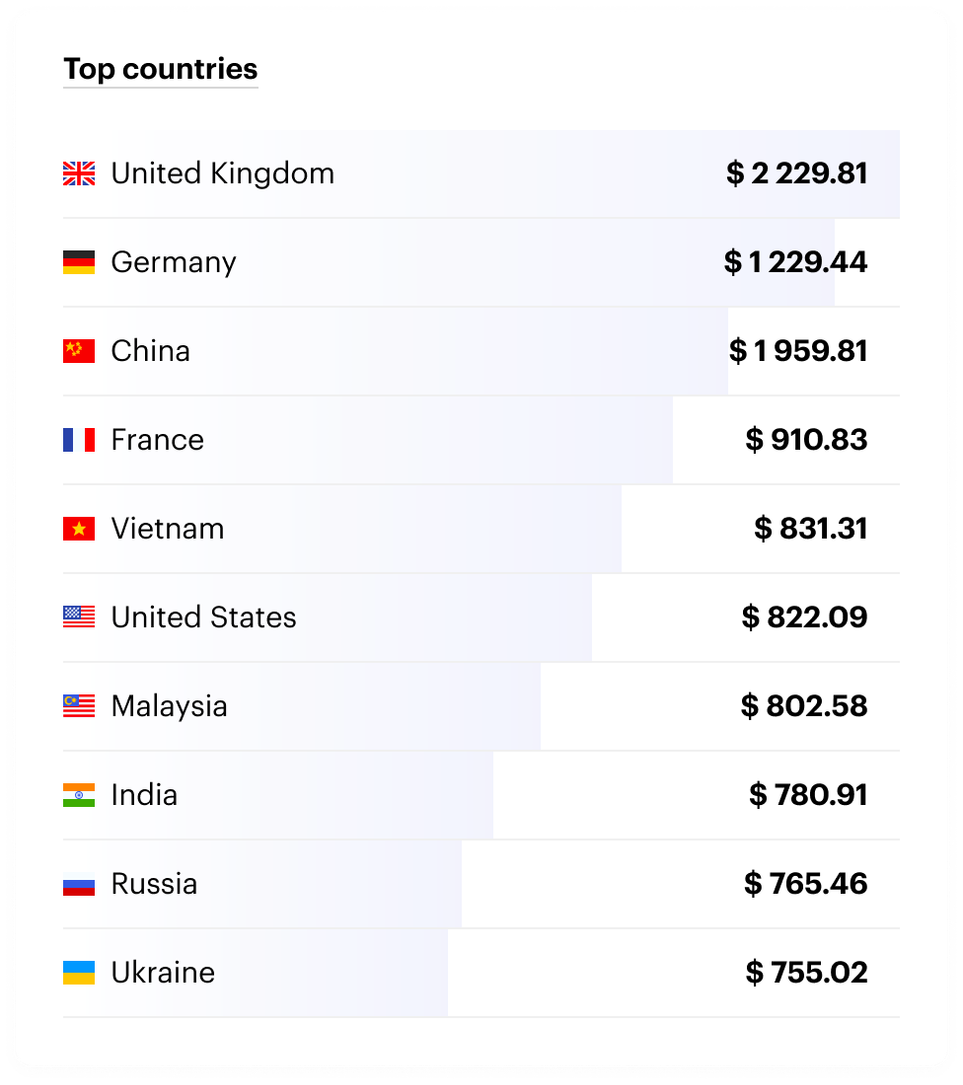
Key Elements:
Country Names & Flags: Each bar represents a country, making it easy to identify at a glance. The countries are listed in descending order, with the top country at the top.
Transaction Volume: The number next to each country shows the total value of transactions from that country. This helps the Partner understand which markets are most active on the Partner's platform.
How to Use the Top Countries Chart:
- Identify Top Markets: Quickly see which countries are generating the most transactions.
- Tailor Partner's Marketing: Use this information to target Partner's marketing efforts towards the most active regions. For example, partners could create localized promotions or content to attract more customers from specific countries.
By understanding where the Partner's customers are located, the Partner can make informed decisions about the Partner's marketing, product offerings, and overall business strategy.
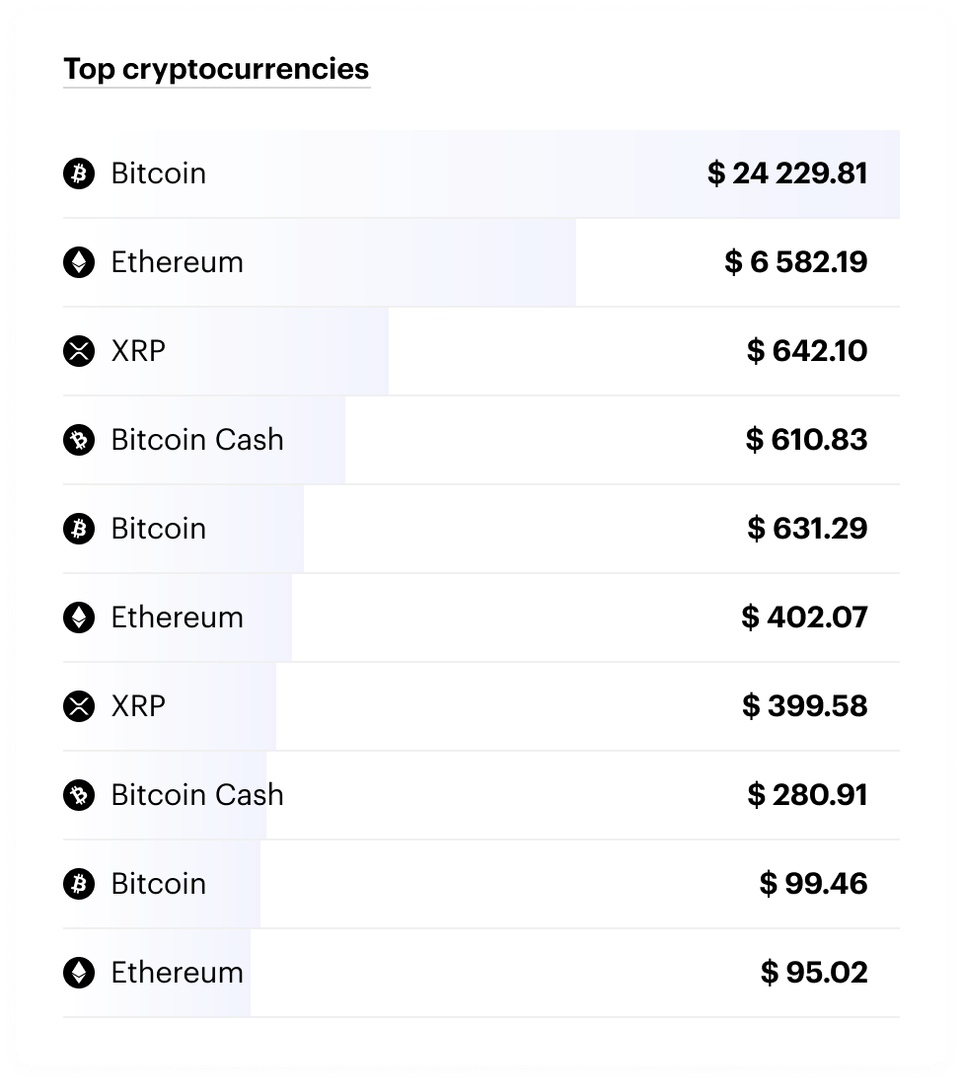
Key Elements
Cryptocurrency Names & Logos: Each bar represents a different cryptocurrency, clearly identified by its logo. The cryptocurrencies are ranked from most to least popular based on transaction volume.
Transaction Volume: The number next to each cryptocurrency shows the total value of transactions for that specific cryptocurrency. This helps Partner understand which ones Partner's customers are buying and selling the most.
How to Use the Top Cryptocurrencies Chart
- Identify Top Choices: Quickly see which cryptocurrencies are generating the most transactions on Partner's platform.
- Tailor Partner's Offerings: Use this information to make sure you're offering the cryptocurrencies that Partner's customers want. Partners might consider adding new options or promoting the most popular ones.
By understanding which cryptocurrencies are most popular with Partner's customers, Partner can make informed decisions about which coins to support, how to market Partner's services, and how to optimize Partner's overall business strategy.
Transaction history
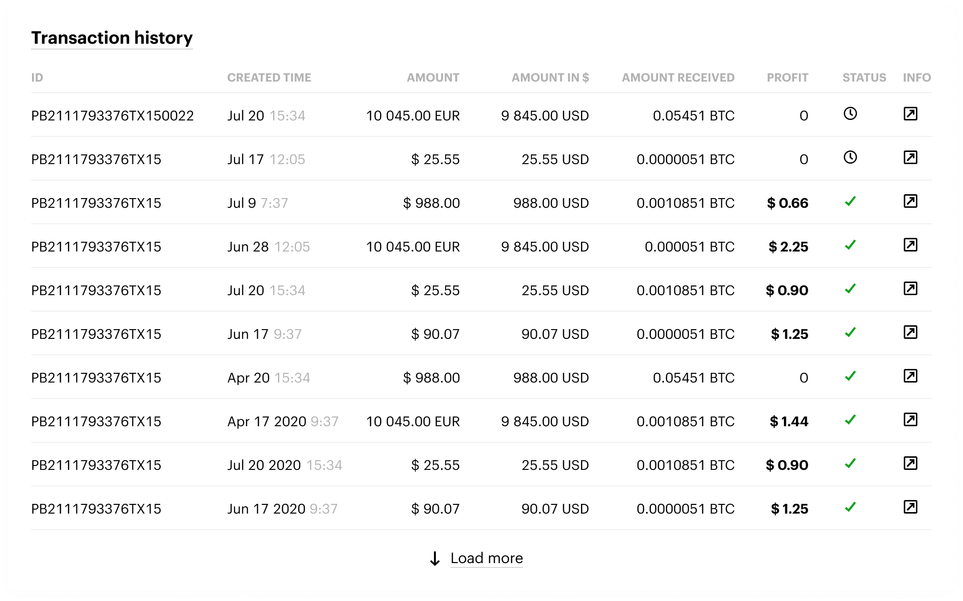
Interface provides Partner with a comprehensive record of all transactions made by Partner's customers.
Table Columns
- ID: A unique code assigned to each transaction, useful for reference or customer support.
- CREATED TIME: The exact date and time the transaction was started.
- AMOUNT: The original amount the customer paid, in the currency they used (e.g., USD, EUR).
- AMOUNT IN $: The transaction amount is converted to US dollars for easy comparison.
- AMOUNT RECEIVED: The amount of cryptocurrency the customer received in the transaction.
- PROFIT: Partner's earnings from this transaction, calculated based on Partner's agreed-upon fee structure.
- STATUS: Shows if the transaction is completed (✓) or still in progress (⌛).
- INFO: Click this button to see more details about a specific transaction, like the payment method used, the customer's information, and the transaction timeline.
How to Use the Transaction History
- Review Past Transactions: Get a quick overview of Partner's transaction history, sorted by date.
- Check Status: See which transactions are completed and which are still pending.
- Get Details: Click "INFO" to dive deeper into any transaction for more information.
- Sort and Filter: Partner can sort the table by any column (click the column header) to find specific transactions.
- Download CSV: If Partner needs to analyze the data further, Partner can download it as a CSV file.
By understanding the Partner's transaction history, Partner can track Partner's earnings, identify trends, and better understand Partner customers' behavior. This information can be valuable for optimizing Partner's business strategy and improving Partner's overall performance with Paybis.
Updated about 1 month ago